Administrative Reports
Reports provide a range of data on the performance of your Koordinates site, including storage, data usage, user engagement, and API metrics.
When enabled, Site Administrators will be able to access the Report menu, find historical records, and download relevant reports.
Access Reports menu
1. From the Top Navigation menu, select the Context Menu to open the dropdown.

2. Select the Report menu.
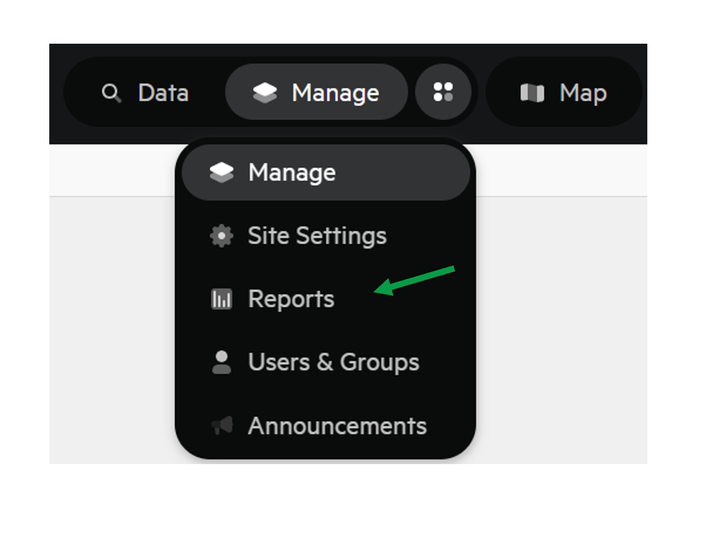
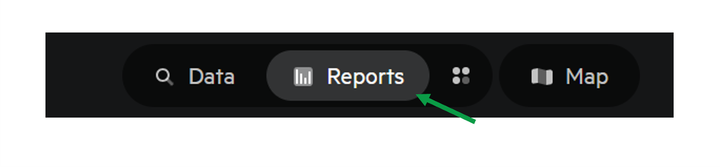
3. The Top Navigation menu will update and indicate which menu is open.
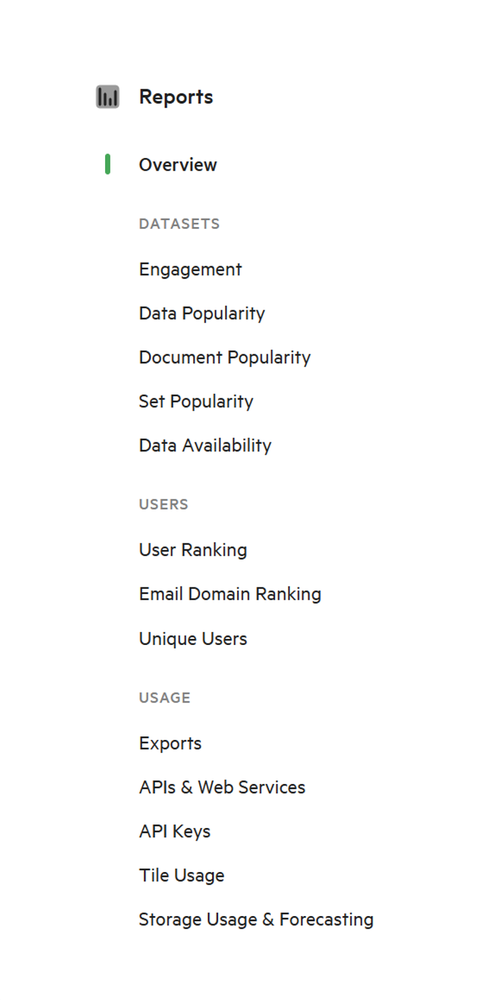
Report Menu
There are 13+ reports available for review. Depending on how your site is utilised, some reports will be more relevant than others.
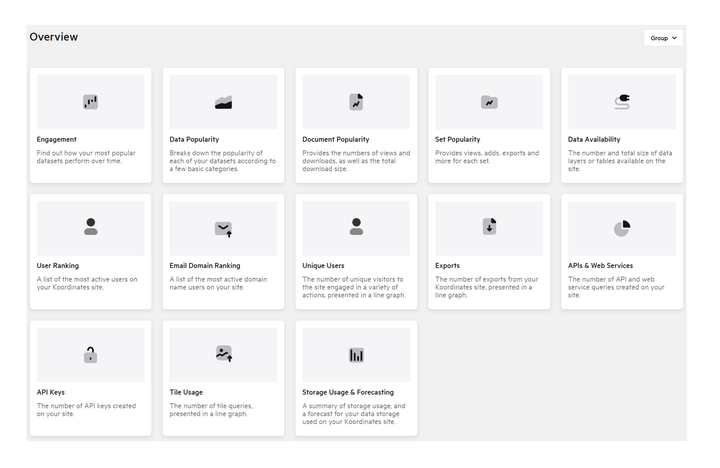
The 13 reports provide insights on 3 areas:
Datasets
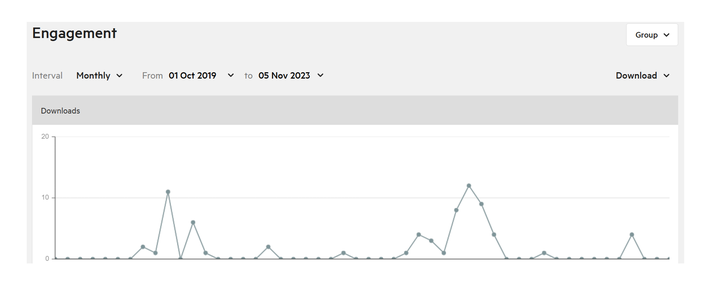
- Engagement: Find out how your most popular datasets perform over time.
- Data Popularity: Breaks down the popularity of each of your datasets according to a few basic categories.
- Document Popularity: Provides the numbers of views and downloads, as well as the total download size.
- Set Popularity: Provides views, adds, exports and more for each set.
- Data Availability: The number and total size of data layers or tables available on the site
Users
- User Ranking: A list of the most active users on your Koordinates site.
- Email Domain Ranking: A list of the most active domain name users on your site.
- Unique Users: The number of unique visitors to the site engaged in a variety of actions, presented in a line graph.
Usage
- Exports: The number of exports from your Koordinates site, presented in a line graph.
- APIs & Web Services: The number of API and web service queries created on your site.
- API Keys: The number of API keys created on your site.
- Tile Usage: The number of tile queries, presented in a line graph.
- Storage Usage & Forecasting: A summary of storage usage, and a forecast for your data storage used on your Koordinates site.
1. On the left-hand side of the Report page, select the relevant report.
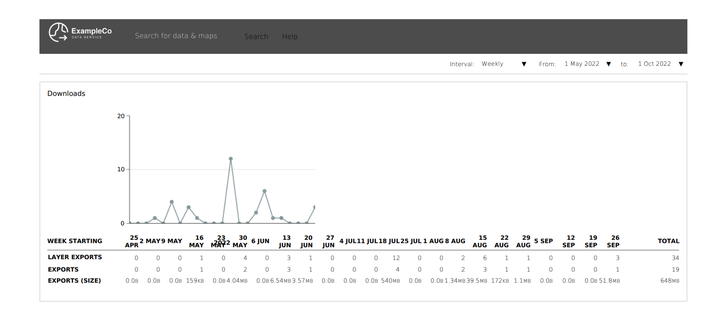
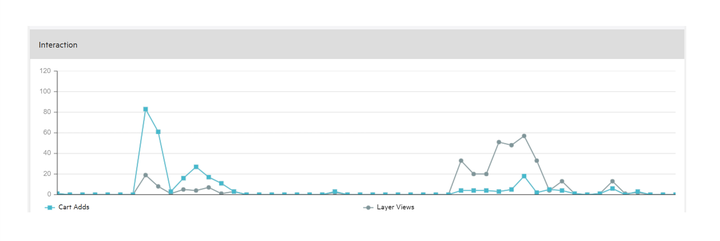
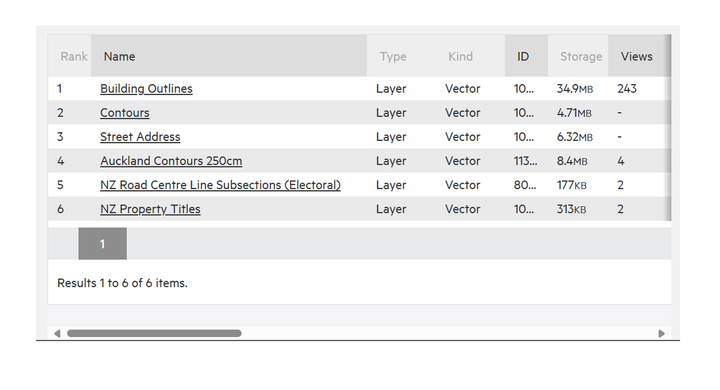
Reports will be made up of a combination of graphs and/or tables, depending on type of information provided.
Charts
Tables
Interacting with reports
Reports can be customised depending on their type.
There are 2 ways to filter the reports.
(a) Time & Interval
(b) Group
Additionally, all reports can be downloaded as PDFs (c).
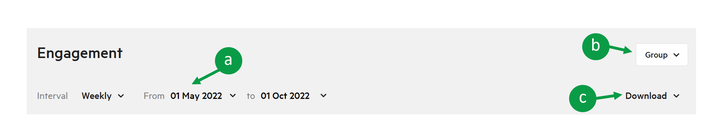
Time & Interval
By default, all reports will be set for the previous month.
If there is a chart element to the report, it will be displaying the information in week intervals.
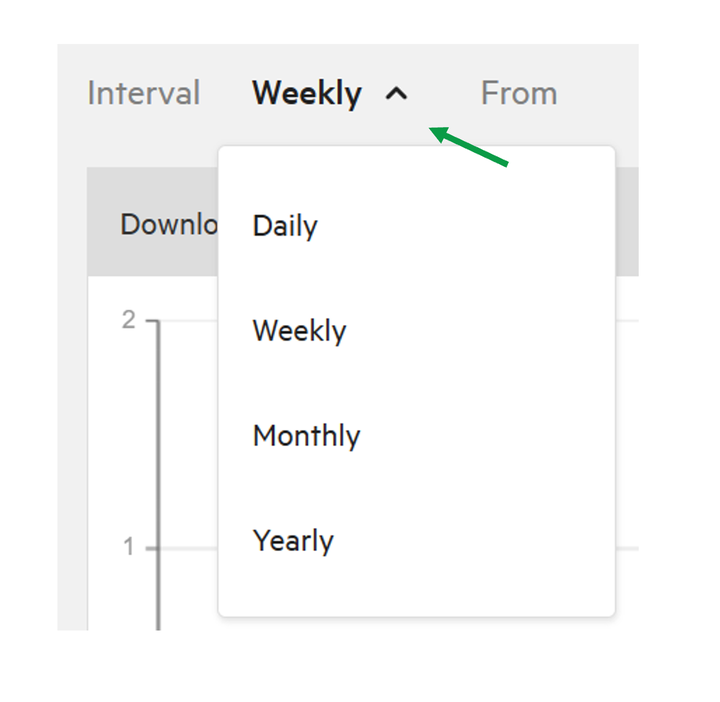
Alter Interval
Intervals can be altered to display data in
- Daily
- Weekly
- Monthly
- Yearly
Note: the greater interval of time chosen, the more aggregated the data will be.
Alternatively, if a more granular interval (daily) is chosen, the accompanying table may become too difficult to read, as more columns are added.
1. From the Interval dropdown, select the desired interval.
Time
Reports can be run for the entire life of the site. to
1. For the From and To options, select the month, year and day for the report to include.
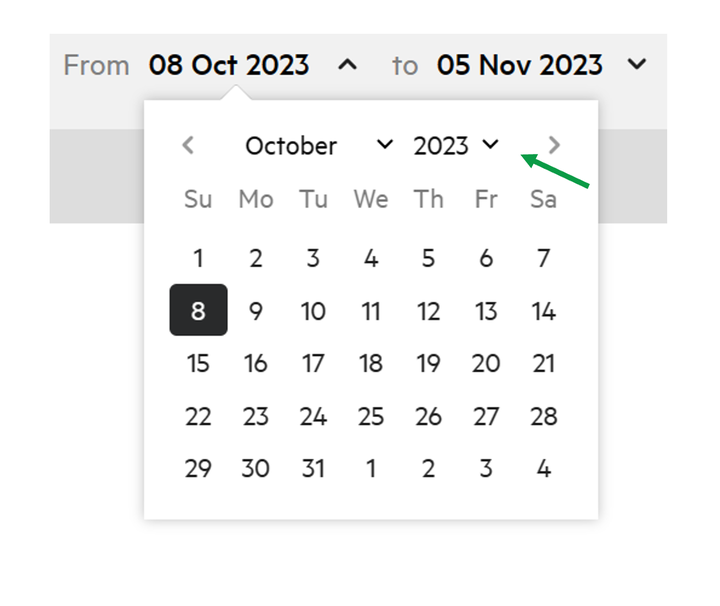
A day, month and year must be selected for the From or To field to update.
Each time the Interval and Time fields are altered, the report with regenerate with the relevant data.
Groups
By default, all Groups will be displayed in the reports. If Site Admins have utilised Groups to sort data, the reports can be filtered by individual groups.
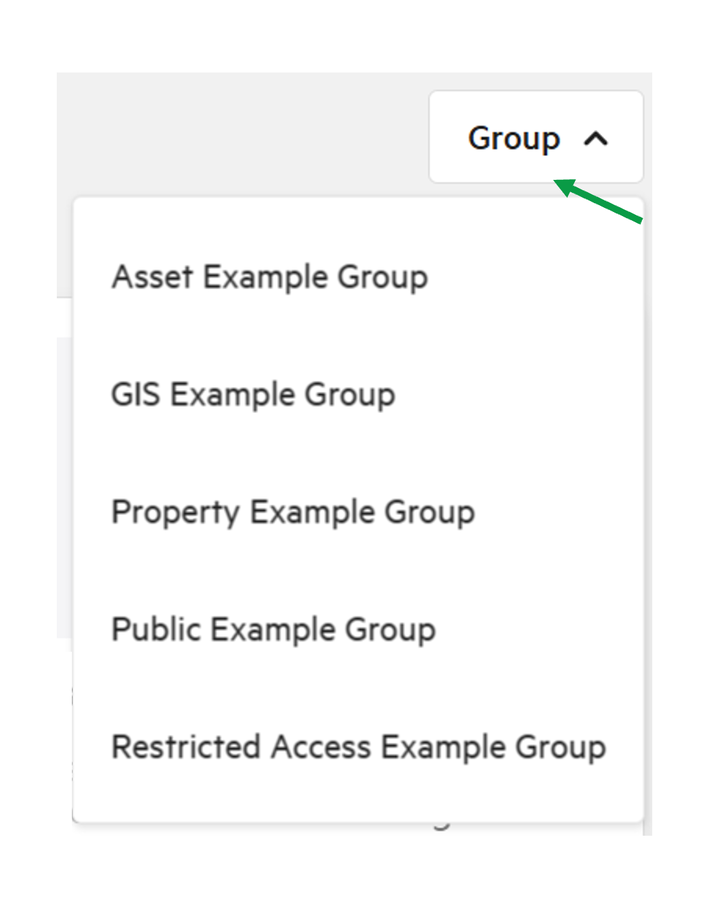
This selection will need to be made each time you select a different report.
Download
All reports can be downloaded as PDFs.
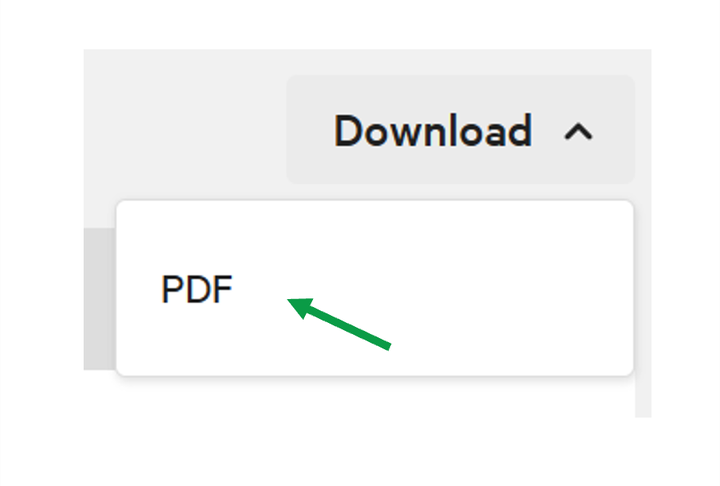
The PDFs will include all tables and charts included in the report type.